Tag: linux

add custom metrics in influxDB


If you have a influxdb server running , there is some data collector like Collectd that can be used to automatically write data in your database.
But collectd is very difficult to personalise. and the documentation is pretty bad, (try using the curl plugin and greping data)
You can’t easily add the result of a piped bash command to the collected data for example.

in my case i’ve decided to ignore these pre made solutions that never completely satisfy my needs or write exactly the value i want in the database,

there is a simple way to use a http request to write in the influxDB database.
first before you even write something in ingluxDB, you have to create a database (you only have to launch this command once)

curl -G http://localhost:8086/query --data-urlencode "q=CREATE DATABASE metrics"

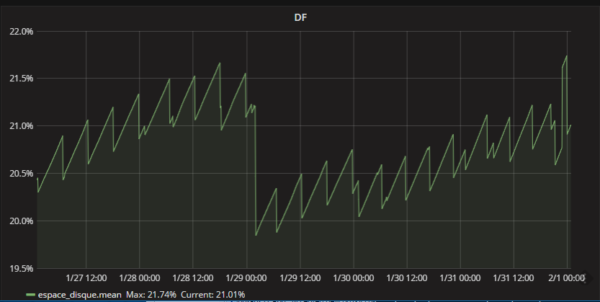
then lets say i want to log every 5min the disk usage in percent of my primary storage device. which is named /dev/mmcblk0p1

the df command is only giving me a rounded value : for example 22%

for my example i want a much more precise percentage ,  this little script does exactly that.

#!/bin/bash
#change mmc by the name of your drive , ex: sdba
df_total=$(df |grep mmc |awk -F' ' '{print $2}')
df_used=$(df |grep mmc |awk -F' ' '{print $3}')
df=$(echo "$df_used * 100 / $df_total" | bc -l | head -c 6)
curl -i -XPOST 'http://localhost:8086/write?db=metrics' --data-binary "disc_space,df=used value=$df"

this is writing in the database metrics the percentage used with 3 decimals if you are using 10% or more and 4 decimals if you use 10% or less
the changing precision is not a concern in my use case.

then if you want a value every 5min for example do a crontab -e  and add the line :

*/5 * * * * bash /root/myscript.sh


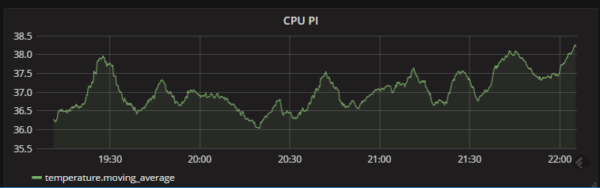
you can then use grafana for example to graph the data.

install Grafana 5 on a PI

If you have a OrangePi or a raspberry pi ,

there is high chance that the version of grafana package in the repositories of your distribution is outdated
in my case , i use armbian , the repo is from ubuntu xenial .

the version of Grafana in the xenial repo is antique (grafana 2.6.0) and the version is bugged if you use a Headless version of the os ,
the icon are not displayed when you are connected to the grafana interface. (because of a bug in phantomJS).

if you have already the 2.6.0 runing , remove it first

apt-get remove grafana

Then use this page to download a recent version of grafana compiled to run on a arm cpu

wget https://github.com/fg2it/grafana-on-raspberry/releases/download/v5.0.4/grafana_5.0.4_armhf.deb
then 
dpkg -i grafana_5.0.4_armhf.deb

if the grafana service is not auto starting at the system boot , you can launch that command :

systemctl enable grafana-server.service

you can check with netstat that your grafana service is running if your server is listening on the tcp port 3000

netstat -tcp -l

now start your browser and try to connect to http://ip-of-your-server:3000


Orange PI Zero : Control the onboard leds


The Orange PI zero is equipped with two onboard leds ,


One red , and one green ,
armbian give you the ability to control very easily the state of theses leds.

to turn on the red led you can use this command : echo 1 > /sys/class/leds/red_led/brightness
to turn off the red led you can simply launch : echo 0 > /sys/class/leds/red_led/brightness

to turn on the green led you can use this command : echo 1 > /sys/class/leds/green_led/brightness
to turn off the green led you can simply launch : echo 0 > /sys/class/leds/green_led/brightness

You can put some sleep command between the on and off, and use this functionality to notify you for example that a cron script is running.

Orange Pi Zero : How to get the CPU temperature

If you purchased the small yet awesome orange pi zero on Aliexpress you certainly had huge problems to download some OS images on the official Orange PI website ,

you can download an image on the armbian website that’s compatible with the Orange pi zero

when your orange pi zero is finally fonctional there is several way to get the current temperature of the CPU.

first you can use the command : armbianmonitor -m this command is going to give you , the uptime , cpu speed and the current CPU temperature every 6 seconds.


but if you want to get that temperature for graphing purpose for cacti , munin , or grafana this command is not going to be usefull because of the autorefresh functionality

there is an other command that just return the cpu temperature

cat /sys/devices/virtual/thermal/thermal_zone1/temp 

OR

cat /sys/devices/virtual/thermal/thermal_zone0/temp

there is two sensor inside the Allwinner H2+ , you can add the two values and then divide the result by two to get an average temperature.

then you can graph the temperature using grafana for example

now that you know the temperature of your PI , you can somthing about it :
in an other article i talk about using the GPIOs of the PI to activate a fan when the temperature reach a set threshold.